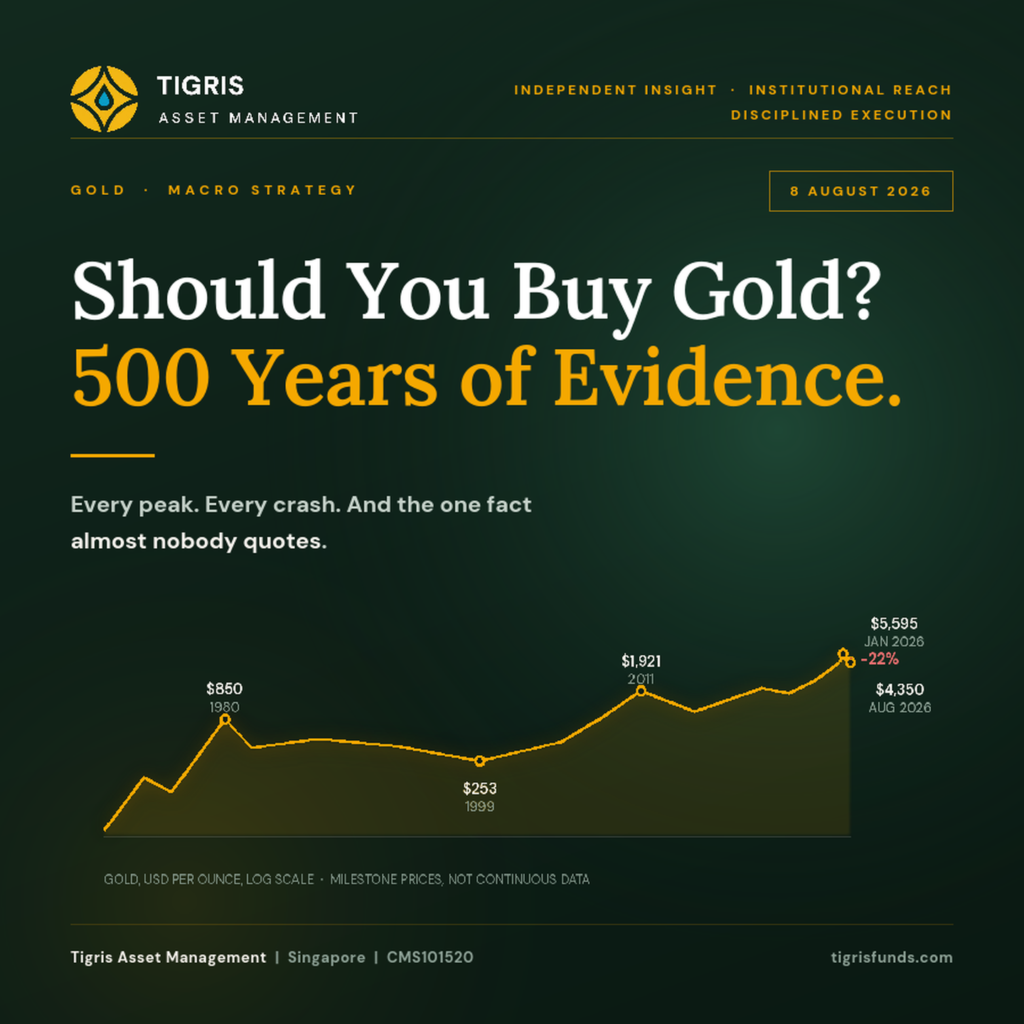
Gold is not an investment in the ordinary sense. It earns nothing, pays nothing and cannot compound, so it has no internal engine of return. Five centuries of evidence show that gold preserves purchasing power across very long periods, and frequently fails to do so across the horizons investors actually live with. So should you invest in gold? The answer depends far less on your view of gold than on what you already own, and on what you are paying for the protection on the day you buy it.
In August 2026 gold trades near $4,350 an ounce. That is roughly 22% below the record of just under $5,600 set on 29 January 2026, and roughly seventeen times what it cost at the turn of the century. Both facts describe the same metal in the same year. Holding them in mind at once is most of the analytical work.
The gold crash most investors have already forgotten
2025 was the year gold did everything its supporters promised. It set 53 all-time highs and averaged $3,431 for the year, itself a record. January 2026 then went close to vertical, with gold gaining almost 30% in a single month and touching just under $5,600 on 29 January.
Then it broke. Over 29 and 30 January gold fell around 9% in a session and silver lost more than 30% in roughly thirty hours. Nothing about gold had changed. Equity markets were selling off on disappointing artificial intelligence earnings, leveraged crypto positions were being force-closed, and exchanges raised margin requirements in the middle of the panic. Investors who suddenly needed cash sold what they were able to sell, and gold is among the most liquid assets anyone owns. On the day it was most needed as a hedge, gold behaved instead as collateral.
A second, slower shock followed. The United States and Iran entered open conflict from late February, and the Strait of Hormuz became the defining macro risk of the year. Received wisdom says war is good for gold. It was not. Higher energy prices lifted inflation, which pushed the Federal Reserve under new chair Kevin Warsh towards tightening rather than easing, which lifted real interest rates. Gold fell between 14% and 16% over the second quarter, its worst quarter since 2013, and dipped below $4,000 on 24 June for the first time since November 2025.
It has since recovered towards $4,350, helped by a weak July payrolls report in which the American economy shed 23,000 jobs against expectations of a gain of around 80,000. That is the whole argument compressed into one year. Gold fell on war and rose on unemployment.
Five centuries, two completely different assets
Most writing about gold quietly commits a statistical crime. It splices together two data sets with opposite properties and presents the result as one continuous history.
1560 to 1971: when gold was money
The definitive long-run study is Roy Jastram’s The Golden Constant, which tracks gold against wholesale prices in England from 1560 and in the United States from 1800, later extended by Jill Leyland for the World Gold Council. Its headline conclusion is the famous one. Over centuries, gold’s purchasing power fluctuates around a broadly flat line. A German family holding gold in 1890 could buy roughly the same basket of goods with it a century later, while any quantity of German currency held across the same period became worthless.
Its second conclusion is the one almost nobody quotes. Before 1971, gold was a poor hedge against major inflation, and it gained purchasing power during deflation. That sounds absurd until you see why. For most of those four centuries gold either was money or was rigidly tied to it. Isaac Newton fixed the English price at £3 17s 10½d per troy ounce in 1717, and that price survived, with one wartime interruption, until Britain abandoned the gold standard in 1931. When prices rise and money loses value, an asset that is money loses value alongside it. The relationship was never a puzzle. It was arithmetic.
1971 onwards: when gold became a bet against money
On 15 August 1971 President Nixon suspended the dollar’s convertibility into gold and the fixed price ended. At that moment gold stopped being the denominator and became a claim against it. The sign on the inflation relationship flipped, and gold began behaving the way modern investors assume it always has.
This matters practically. Anyone citing five hundred years of gold as an inflation hedge is describing something that has been true for 55 of those years. The genuine constant across the whole period is narrower and considerably more useful. Gold is the asset people move into when they doubt the institution that issues their money. Sometimes that doubt concerns inflation. Sometimes it concerns currency depreciation, sanctions, war or fiscal solvency. The trigger changes. The behaviour does not.
Every peak and every crash
The table below sets out gold’s major highs and the falls that followed them. The final column is the part investors consistently underestimate.
| Peak | Level | What drove it | The fall that followed | Time to regain the high |
|---|---|---|---|---|
| 1717 to 1931 | £3 17s 10½d, fixed | Newton’s mint ratio, then the classical gold standard | No market crash, but purchasing power fell during every inflation | Not applicable |
| Jan 1934 | $35, revalued from $20.67 | US devaluation under the Gold Reserve Act | Private American ownership banned from 1933 to 1974 | Price administered until 1971 |
| Jan 1980 | $850 | Stagflation, the Iranian revolution, the Soviet invasion of Afghanistan | Down 70% to $253 by 1999 | 28 years in nominal terms, 45 years in real terms |
| Sep 2011 | $1,921 | Global financial crisis, quantitative easing, euro sovereign debt | Down 45% to about $1,050 by late 2015 | Roughly nine years |
| Aug 2020 | $2,075 | Pandemic response, deeply negative real yields | Flat to lower for two years | Roughly four years |
| Jan 2026 | Just under $5,600 | Central bank buying, de-dollarisation, expected rate cuts, leverage | Down 29% to below $4,000 by June 2026 | Unresolved |
Two rows deserve emphasis. The 1980 high took 28 years to recover in cash terms and 45 years to recover in purchasing power, with gold only surpassing its inflation-adjusted 1980 peak in September 2025. Anyone who bought the top in January 1980 spent an entire working career underwater in real terms. That is not a tail risk. It is a documented outcome, and it happened to the asset most frequently sold as safety.
The 1999 low carries its own lesson. Britain sold roughly 400 tonnes of reserves between 1999 and 2002 at an average of about $275 an ounce, announcing the sales in advance and depressing the price it received. Official institutions are not automatically wiser than anybody else. They simply have longer to be wrong.
Why does gold have any value at all?
This deserves a plain answer, because the honest one is uncomfortable.
Gold has no cash flows, so it cannot be valued the way a company or a bond is valued. There is no discount rate that produces a fair price. What gold has instead are four durable properties. It is scarce, it is effectively indestructible, it is easy to verify, and it is nobody’s liability. That last point carries most of the weight. Every other financial asset is somebody’s promise. A bond is a government’s promise. A bank deposit is a bank’s promise. Gold is the only major reserve asset that cannot be frozen by an adversary or defaulted on by an issuer.
Scarcity is real but often overstated. The World Gold Council estimates that around 219,891 tonnes of gold had been mined by the end of 2025, enough to form a cube roughly 22 metres on each side, and less than one troy ounce per person alive. Record mine output of 3,672 tonnes in 2025 expanded that stock by only 1.7%. Supply is therefore close to fixed in any given year, which means the price is set almost entirely by shifts in demand.
Those shifts have been remarkable. According to the European Central Bank, gold rose to 27% of global central bank reserve assets at the end of 2025, up from 20% a year earlier, overtaking US Treasuries, which fell to 22%. Dollar-denominated assets in aggregate remain the largest single bloc at 42%. Central banks now hold more than 36,000 tonnes between them. The acceleration began in 2022, when Russia’s foreign reserves were frozen and every reserve manager in the world learned that paper claims held abroad can be switched off by decree.
A simpler way to read the gold price: the two-ledger model
Most confusion about gold comes from applying one explanation to a price that is set by two.
Ledger one is trust. It measures how much confidence the world places in the institutions that issue money. It moves slowly, across years and decades, and it is driven by reserve policy, sanctions risk, fiscal trajectories and the credibility of central banks. This ledger has been improving for gold since 2022 and has not stopped. Central banks bought about 863 tonnes in 2025 after three consecutive years above 1,000 tonnes, roughly double the pace of the previous decade. In the World Gold Council’s June 2026 survey, 89% of reserve managers expected global official gold holdings to keep rising, and a record 45% expected their own institution to add.
Ledger two is carry. It measures what it costs to hold an asset that pays no interest. It moves quickly, across weeks, and it is driven by real interest rates, the dollar and the quantity of borrowed money sitting in gold positions. This ledger turned violently against gold in the second quarter of 2026 as the Fed shifted hawkish. One market estimate put gold’s sensitivity at roughly $20 an ounce for every basis point rise in ten-year real yields from late February onwards.
The price is set by whichever ledger is moving faster. Through 2024 and 2025 both moved in gold’s favour, and the result was a historic rally. In the second quarter of 2026 the trust ledger barely moved while the carry ledger deteriorated sharply, and gold fell 16% even as central banks bought a further 289 tonnes. None of that is contradictory once you stop expecting a single number to explain both.
This is a Tigris interpretation rather than an established framework, and, as with the other analytical frameworks we publish on Tigris Insights, we would treat it as falsifiable. If the trust ledger is genuinely structural, official sector net buying should hold above roughly 700 tonnes a year through 2027 even if the price falls further. If net official buying drops below 500 tonnes across any four-quarter window while prices decline, the structural case is weaker than its advocates claim, and gold is a rates trade wearing a geopolitical costume.
So should you invest in gold?
The honest case for
Gold is the only liquid asset with no counterparty. In a genuine sovereign or currency crisis, that property cannot be replicated by anything else in a portfolio. The official sector is buying it for precisely this reason, and reserve managers are not momentum traders. There is also a live demand story outside Western headlines. Asian gold ETF inflows in the first half of 2026 were the strongest on record at 70 tonnes, while North America recorded its weakest first half since 2013 at minus 61 tonnes. The people selling and the people buying are not in the same place, and they are not making the same argument.
The honest case against
Gold does not compound, and across long periods that gap becomes enormous. The UBS Global Investment Returns Yearbook, compiled by Dimson, Marsh and Staunton, puts world equities at 5.2% real per year since 1900 and bonds at 1.7%. Gold, which the same database tracks only from 1972 because it was not freely tradable before then, has delivered materially lower real returns with higher volatility. Its correlation with inflation since 1972 is roughly 0.34, which describes a relationship rather than a hedge.
Positioning is a second live risk. Standard Chartered estimated in June 2026 that roughly 298 tonnes of gold held inside ETFs sat at a loss at prices near $4,000. Those are not long-term holders. They are people waiting for a level at which they can leave, and every rally towards their entry point creates fresh supply.
How we would frame the decision
The useful reframing is this. Gold is not a return-seeking asset. It is insurance with a floating premium, and the only question that matters is whether the premium is reasonable relative to what is being insured.
Three practical consequences follow. First, size the position against the risk being hedged rather than against a price view. An allocation that is meaningful in a crisis is usually smaller than enthusiasm suggests. Second, accept that gold will often fall in the first week of a crisis, because leveraged holders are forced to sell it for cash. If a portfolio plan requires gold to work on day one, the plan is wrong. Third, note that gold is currently expensive against its own history, having only recently exceeded its 1980 peak in real terms. Buying insurance is sensible. Buying it after the premium has trebled requires a clearer view of the risk than most investors genuinely hold.
One regional data point is worth watching. The Monetary Authority of Singapore holds around 197 tonnes, and its purchase of 4 tonnes in May 2026 was its first net addition since September 2025. One of Asia’s most disciplined reserve managers therefore added nothing across the entire blow-off top and resumed only after the correction. We would not present that as deliberate market timing, and MAS does not publish its reasoning, but it is a more instructive pattern than most commentary offers.
Fact, interpretation and forecast
| Category | Statement | Basis |
|---|---|---|
| Verified fact | Gold peaked just under $5,600 on 29 January 2026 and traded below $4,000 on 24 June 2026, its worst quarter since 2013 | Invesco quarterly outlook, UBS CIO, LBMA pricing |
| Verified fact | Gold reached 27% of global central bank reserve assets at end-2025, overtaking US Treasuries at 22% | European Central Bank, June 2026 |
| Verified fact | Gold surpassed its inflation-adjusted January 1980 peak only in September 2025 | Bloomberg |
| Verified fact | Before 1971, gold’s purchasing power fell during inflation and rose during deflation | Jastram, The Golden Constant |
| Tigris interpretation | Gold’s price is best read as two separate ledgers, trust and carry, with the faster-moving one dominating | Our framework, not an industry standard |
| Tigris interpretation | January 2026 demonstrated that gold functions as collateral before it functions as a hedge | Inference from the liquidation sequence |
| Forecast, uncertain | Sell-side year-end 2026 targets span roughly $4,300 to $6,300, a spread of nearly 50% | Goldman Sachs, Deutsche Bank, Barclays, JP Morgan |
| Falsifiable test | Official sector net buying below 500 tonnes across four quarters, alongside falling prices, would weaken the structural case | Tigris, testable against World Gold Council data |
Frequently asked questions
Is gold a good hedge against inflation?
Across decades, yes. Across the three to five year horizons most investors actually use, no. The correlation between gold and inflation since 1972 is about 0.34, meaning gold often rises with inflation and often does not. Before 1971 the relationship ran the other way entirely, because gold was money rather than a hedge against it.
Why did gold fall when the United States and Iran went to war?
Because the conflict pushed oil and therefore inflation higher, which made the Federal Reserve more hawkish, which raised real interest rates. Gold pays no interest, so higher real rates increase the cost of holding it. The rates effect overwhelmed the geopolitical premium, which is the opposite of what most investors expected.
How much gold should be in a portfolio?
There is no universal answer, and anyone offering a single number is usually selling something. The sensible method works backwards from the specific risk being hedged, then sizes the position so that it is meaningful in that scenario without materially reducing expected returns in the scenarios that are more likely to occur.
Can gold fall for a very long time?
Yes, and it has. Gold fell 70% between January 1980 and 1999 and took 45 years to recover in purchasing-power terms. It fell 45% between 2011 and 2015. Extended drawdowns are a normal feature of the asset rather than an anomaly, and they arrive without warning.
Is central bank buying a guaranteed floor under the gold price?
No. Central banks are buyers most of the time, but they sell when they need liquidity. Turkey sold or lent roughly 130 tonnes in early 2026 to defend its currency, having accumulated about 220 tonnes since 2022. Official demand is a strong support, not a floor.
The question worth holding
Gold has done its job for five hundred years, but the job description changed in 1971 and much of the market is still reading the old one. What survived the change is not an inflation hedge. It is something narrower and more durable: the asset people reach for when they stop believing the institution that prints their money.
That belief is being tested harder now than at any point since Bretton Woods, which is a reason to own some gold. It has also already been repriced to record levels in real terms, which is a reason to be careful about how much. The interesting question was never whether gold works. It is whether the protection is still cheap enough to be worth buying, and on that, January’s buyers and June’s sellers have already given very different answers.
Further analysis of macro positioning, rates and credit is available on the Tigris Insights page.
This material is for informational purposes only and does not constitute an offer or solicitation to buy or sell any investment product. Past performance is not indicative of future results. Investment products are available only to accredited and institutional investors as defined under the Securities and Futures Act 2001 of Singapore. Tigris Asset Management Pte Ltd holds Capital Markets Services Licence CMS101520 issued by the Monetary Authority of Singapore.
